

Table of Contents
- HOW TO MANAGE P/E
- Introduction to P/E Ratio
- Evaluating High vs. Low P/E
- Contextual Analysis
- Monitoring P/E Fluctuations
- REVENUE OF A COMPANY
- Revenue as One of the Financial Figures
- Revenue Growth as an Index of Business Development
- Revenue vs. Profit: Understanding the Difference
- Revenue Trends and Market Position
- ROI
- Introduction to ROI
- Understanding the ROI Formula
- Role of ROI in Stock Market Investments
- Using ROI to Select High-Quality Stocks
- Limitations of ROI in the Stock Market
- CONCLUSION
HOW TO MANAGE P/E
Introduction to P/E Ratio
This gives the ratio of stock price to EPS, and it shows how often investors are willing to pay for each dollar of the company's earnings. On the contrary, a low P/E ratio may indicate that the particular stock is cheap or that the company's revenue growth rate is less than expected.
So, over and above the individual stock values, investors are advised to use the P/E ratios of competing firms in the same business sector better to understand over- and underrated stocks about other bet-rated companies. Using P/E analysis as a part of another approach, where possible criteria for investment include – internal and external fundamentals of firms, equity characteristics, and macroeconomic situation, enables investors to minimize risk exposure and maximize the expected rate of return for anyone intending to invest in quality stocks over the long term, gaining and applying knowledge of the P/E ratio is critical.
Evaluating High vs. Low P/E
The P/E ratio is used in valuing stock since it lets the investor know whether it is highly priced or low priced. Hence, a high P/E ratio implies that investors are still optimistic that the company will register high future growth and, therefore, a high stock price for its earnings. Indeed, high P/E stocks may have great prospects, but these come with relatively greater risks. It is considered overvalued to attract a high price, and if the growth of the company's sales is not constant, investors can lose money. Supporting this by stating that growth stocks tend to have higher P/E ratios, especially where the referring industries are technology-oriented.
Although low P/E ratios show that a share is cheap, they may sometimes result from poor finances or dwindling earnings, and thus, one needs to conduct some analysis to determine whether the share is valueless.
When comparing P/E ratios, it is worth noting that they differ among industries, and their means/averages differ among sectors.
Contextual Analysis
Evaluation of the common investment factors is essential, especially in evaluating the P/E ratio of equities. It is recommended that instead of solely focusing on the P/E, investors should try to understand its coefficients according to the current state of the economy as well as particular industry to make correct conclusions regarding the company's shares value. Using P/E ratios as a benchmark makes it easier to determine a firm's position in its industry because its P/E ratio can be compared to the industry mean. A high P/E might depict a stock's prospect of future growth as higher than the industry average, whereas a low P/E might show the stock having at par or lower prospects than the industry average.
Economic cycles also define a critical aspect of contextual analysis. In times of economic prosperity, the P/E tends to be higher than during economic downturns because of optimistic investors' expectations. On the other hand, even good companies will have low P/E ratios in recessions or phases when the economy is not performing well.
It is vigorous to say that the methodology of contextual analysis assists investors in avoiding stereotypes and makes the decision-making process much more reasonable and better adjusted when comparing the P/E ratios adjusted by the conditions of an industry or a market.
Monitoring P/E Fluctuations
Every time the P/E changes, it conveys information on changes in the firm's price relative to its earnings due to factors like changed expected earnings growth, changes in relative industry performance, and macroeconomic information.
On performance, investors should seek to find out how quarterly earnings matched against market expectations.If the P/E ratio has risen sharply, equities have been overvalued relative to profit-making. When doing the P/E ratio, a big number means the stock is overpriced when no good features support this. On the other hand, a low P-E ratio could mean that the stock is cheap for the amount of money you want to use to purchase it.
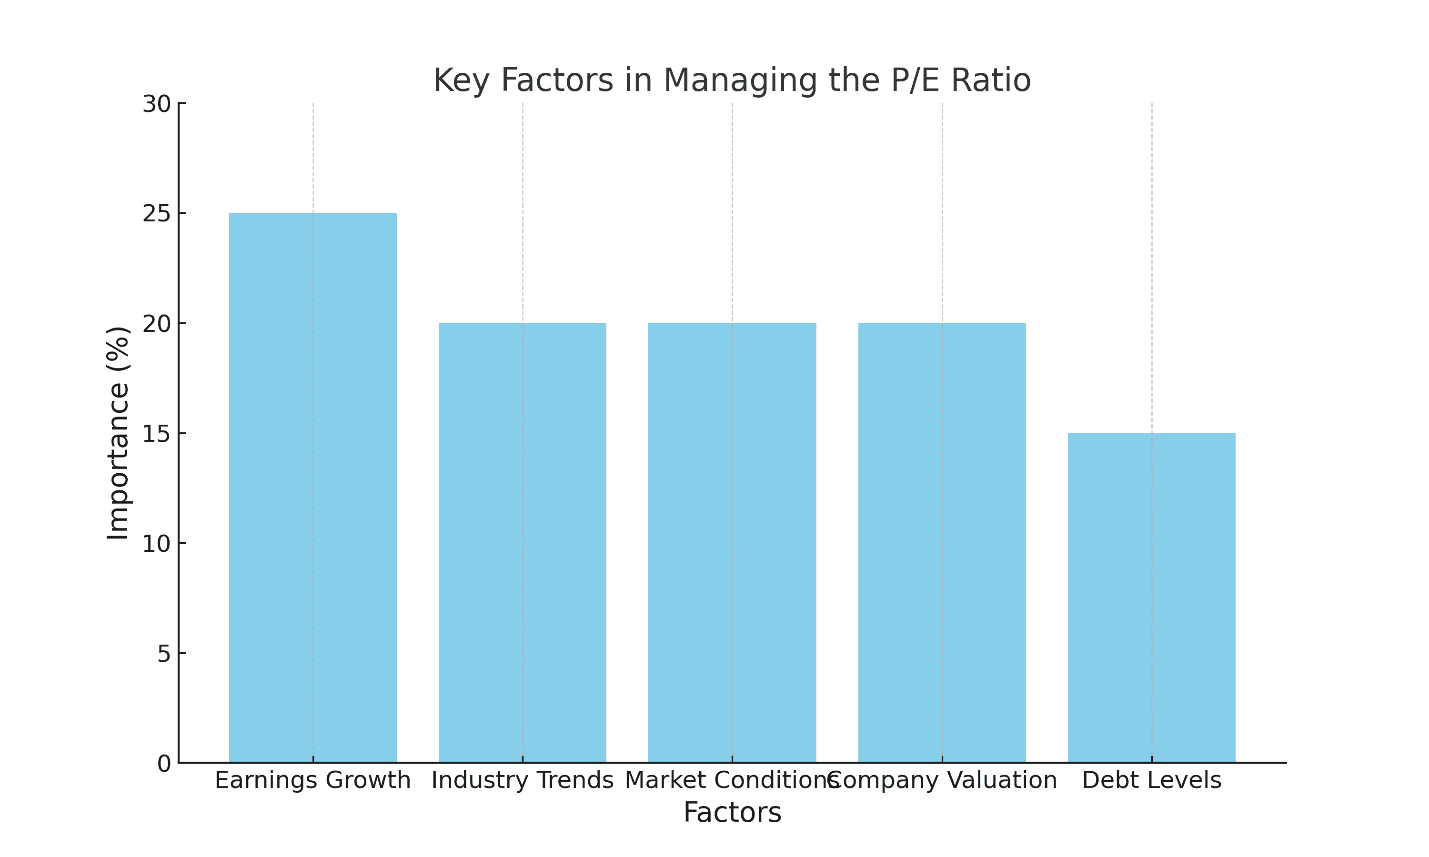
How to Manage P/e (Price-to-earnings) Ratio
| STEPS | DESCRIPTION |
|---|---|
| Understand P/E Ratio | The price-to-earn ratio divides the market price of a company’s share by the EPS. A high P/E may imply over-undervaluation, which is indicated by a low P/E. |
| Evaluate Industry Standards | Use the simple P/E ratio to compare the firms' P/E ratio with the industry average to determine if the stock is fairly priced or overpriced compared to its competitors. |
| Consider Growth Prospects | A higher P/E ratio can also be explained by investors willing to spend more money to obtain one unit of earnings if this earnings per share is expected to improve significantly, as the business is projected to have an above-average growth rate. |
| Look at Historical P/E | Using contrast, the company's historical P/E ratio will be compared to the current P/E to identify moments when this ratio was closer to the industry average or whether the current P/E indicates an anomaly. |
| Account for Market Sentiment | Realize that the P/E ratios come with some bias from the market sentiment, optimism, or fear prevailing in the market influences the valuation. |
| Monitor Earnings Stability | Thus, 1999 posited that industries or companies with high and growing earnings have more acceptable P/E ratios than others. Evaluate earnings stability as a way of dealing with P/E screener distortions. |
| Adjust for Cyclical Sectors | Due to cyclical industries, PE ratios can vary widely. The business community must learn to manage expectations, particularly in areas such as energy or manufacturing, where profits fluctuate. |
REVENUE OF A COMPANY
Revenue as One of the Financial Figures
Revenue is one of the simplest and most important business indicators significantly impacting stock exchange operations.
As for revenue as a figure of assessment in fundamental analysis, it is one more identifier that starts from annual or quarterly numbers based on stakeholders' evaluation of a company's performance. They show the extent of activities and the level of consumption of a firm's commodities or offered services. It has been demonstrated to be consistent, meaning that while a company's cash inflows are steady, the projected gross profit is also likely to rise. However, revenue is insufficient to understand performance and efficiency; thus, revenue needs to be considered in conjunction with profit margins, expenses, and Global Net income.
To shareholders, this concept highlights how a particular company earns its revenues and whether such revenues are sustainable over the long run for a host investor. Revenue growth can affect stock values, and many firms with good revenues tend to be highly valued, which makes its analysis important when developing fundamental approaches to stock market investment.
Revenue Growth as an Index of Business Development
Growth in revenues is often an important segment of the expansion of a business; thus, it is an important segment when considering fundamental investment analysis techniques. It expresses a measure of a capability to sell its stock with the rise in sales over a given period, showing its competitiveness, demand, and financial health. Revenue growth is one of the values that investors rely on to derive the firm's future profitability and the capacity for value addition.
This paper examines the absolute growth of revenues and the causes behind this type of growth. Organic growth mainly occurs from positive business activities such as increased market share, product differentiation, or efficient cost control. At the same time, temporary revenue increases due to short-term factors, market fluctuation, or one-time events cannot be considered the key to sustainable revenue growth.
Traditional approaches used for valuation show that companies with consistent and regular organic revenue growth are viewed by investors as safer and more likely to yield good returns. This growth is attributed to the firm's capacity to maneuver appropriate business conditions and work at a large scale, culminating in steady inflows. In general terms, examining the investment approach and identifying the firms with stable revenue growth are among the factors that help minimize risks in addition to taking advantage of business expansion. Thus, revenue growth is one of the most valuable indicators of possible success in sales on the stock markets.
Revenue vs. Profit: Understanding the Difference
When analyzing companies for stock market investment, revenue and profit should not be used interchangeably. Revenue, commonly called the top line, is the total money an organization receives from its ordinary business operations, like sales of its products or services. It gives a general idea of how an organization can make sales but not how much revenue is converted into profits.
Gross profit, on the other hand, is the total income earned after adding overheads, less all kinds of expenses, taxation, and costs. It is called the bottom line and helps investors better understand the company's real profit. Profit can also be categorized in several ways: gross profit, operating profit, and net profit. They all give different perspectives on the company's financial health phases.
That's why profit has a priority over revenue in terms of investors' interest, as profit indicates the ability to handle and minimize expenses. An organization with high sales but little net profit may have problems with long-term viability. Since revenue and profit also show an organization's financial health, analyzing both factors is important in stock market investment and hence considered one of the important investment criteria.
Revenue Trends and Market Position
In stock market investment decisions, it is very important to consider the investment subject's revenue patterns and market niches. Recurring revenue is a very strong indicator of the enterprise's past, present, and future financial condition. Consistent revenue growth outlines that the business is run efficiently and its stakeholders are aligned with the market requirements for its products or services. Investors should observe quarterly and annual revenues to see growth and compare them to forecasted performance.
Besides, one cannot overemphasize the centrality of market position in determining a company's revenue generation capacity. As a rule, an industry-leading position realizes some pertinent competitive advantages that include economies of scale, customer loyalty, and cost leadership that, in turn, enable it to protect juicy profits. Compared to other firms in this category, firms in highly competitive or declining markets may face a challenge in realizing revenue growth and, by that token, their valuations.
Understanding such dynamics will help formulate at least some basic investment plans. Comparing revenue with industry position helps investors isolate firms possessing sustainable competitive advantages and future growth opportunities. It reduces the likelihood of putting much money into undervalued or overvalued stocks. Finally, the emphasis on revenues and market position may lead to better investment activities in the financial market and a greater return on equities.
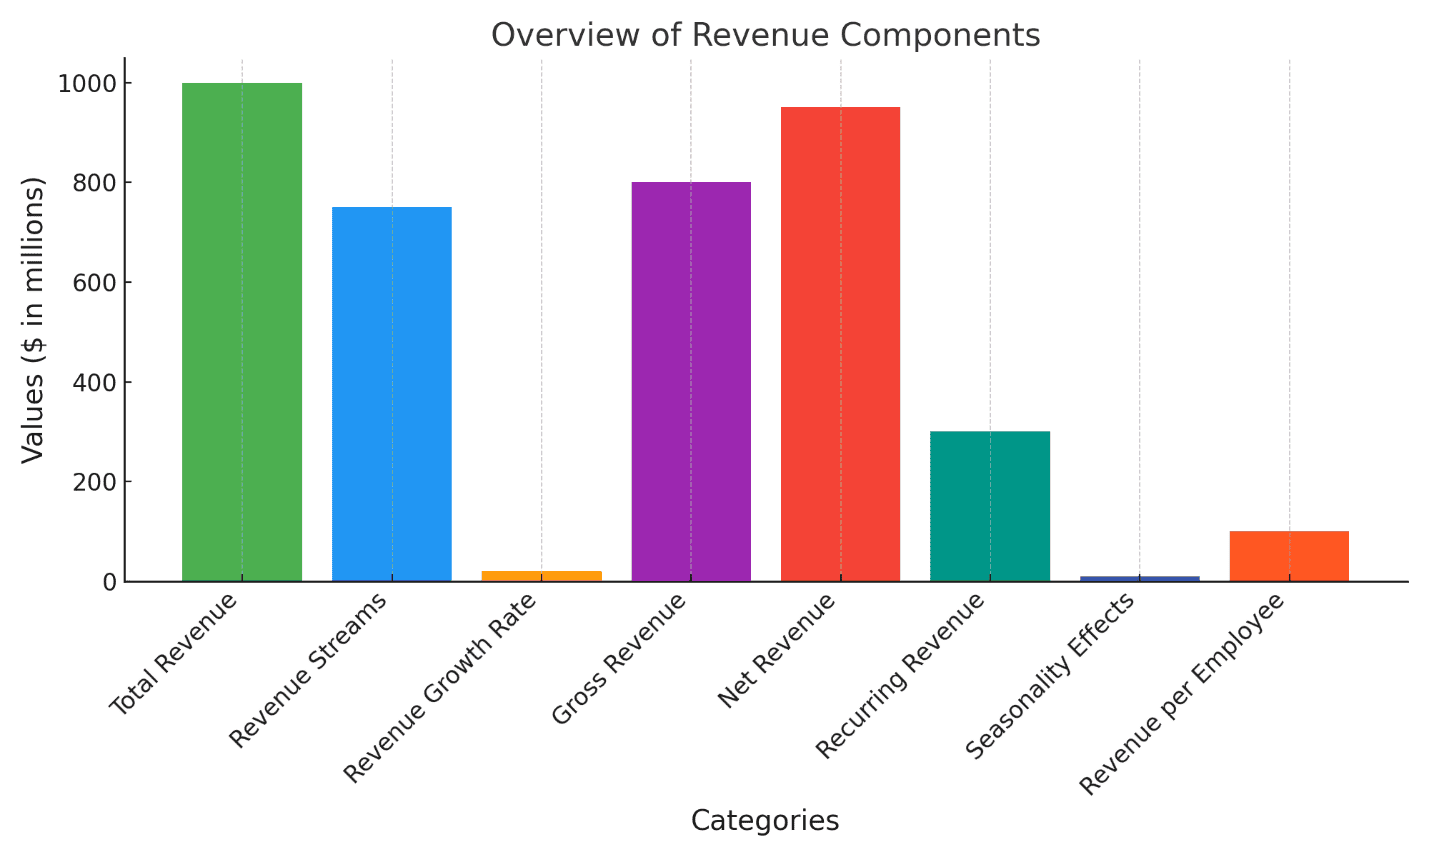
| Revenue Component | Description | Importance |
|---|---|---|
| Total Revenue | That is the sum of the total income in the form of the sales of goods and services. | Provides an overall performance of the company and the required demand from the market. |
| Revenue Streams | They can also be based on segmented forms of individuals' income that they think they spend on products, subscriptions, etc. | As part of an overall strategy, it spreads revenue and minimizes dependence on a single product. |
| Revenue Growth Rate | The relative measure of the changes in revenue from a prior period in terms of a certain percentage. | It also indicates the company‘s growth and market positioning. |
| Gross Revenue | Gross revenue before outstanding returns or allowances have been subtracted in the period. | Explains the efficiency of sales utilization before costs. |
| Net Revenue | Net sales, sales returns, discounts, and allowances. | Illustrates the actual income used in the computation of operating expenses. |
| Recurring Revenue | Additional, regular payments (such as subscriptions). | It provides Cash flow certainty or stability and thus appears to influence a company's funding decisions strongly. |
| Seasonality Effects | Rising production cost due to periodic motions in revenue caused by obvious cyclical market factors. | Contributes to expectations for revenue and expense. |
| Revenue per Employee | Recurring income made by the company is divided by the number of employees. | Shows the ability to run operations efficiently and the effectiveness of the workforce. |
ROI
Introduction to ROI
Return on investment (ROI) can be used to assess investment performance, particularly stock market performance. ROI calculates the rate of return of an investment to its cost and helps investors determine how well they are executing their capital. Defined as the net profit split by the initial investment cost, ROI is presented in percentage form, making it even easier to use when considering other investments. Return on investment is the basis of basic approaches to invest
ing since it's the single most determining factor. Integrating ROI analysis into a basic investment approach revolutionizes portfolio optimization and promotes great stewardship of investors' funds to generate optimal returns from investment resources. As such, ROI is also a helpful means of managing and understanding stock market relationships.
Understanding the ROI Formula
A brief look at the Return on Investment (ROI) formula is essential for anyone interested in evaluating their investments professionals in the share market. ROI is an accountant's measure of the gross or net profit made on an investment based on the initial cost of the investment.
Net profit is the total earnings less the total cost of the investment made on the investment. This percentage assists investors in determining the rate at which their capital works at a given period. Any investment that has attracted a bigger return than the capital invested is considered more attractive. On the other hand, a low ROI or even a negative RO means there is no benefit to the investment. Therefore, it is based on comprehending the formula to calculate ROI; applying the same, investors possess information related to the profitability level for the particular shares that helps them make relevant decisions to achieve the investor's aims.
Role of ROI in Stock Market Investments
ROI normally comes into play with regard to certain key parameters that measure efficiency and profitability for any investment. This, in regard to this, outlines the return on every portfolio or investment opportunity against the cost of.
its acquisition helps assess different stocks and investment proposals. Besides, ROI plays a great role in portfolio management since it allows for the proper selection of investments most likely to produce high returns. Based on management's past performance standards. ROI needs to be combined with the P/E ratio and the ratio of earning growth to give investors an overall picture of how to get the most out of their investments.
Thus, knowing the keenness and ways to use ROI is crucial for investors in the stock exchange business to decide how to divide their investments, hedge risks, and create a stable personal portfolio for the defined goal.
Using ROI to Select High-Quality Stocks
The ROI technique helps improve stock selection, especially if you want high-quality stocks, because it focuses on achieving a high ROI. ROI focuses on establishing the gains of an investment compared to the cost and is an important guide to knowing how a company makes profits from its capital investment. A higher ROI means a company can generate profit from investments, an index of good operations.
Hence, when choosing stocks, the investor should compare companies and go for those with higher ROI figures compared to other firms in the industry. It shows efficient management and coherent strategic planning of resources since changes are not favored. Besides, trends of the rates of return on investment over some period may indicate how effective the company is in managing its operations in response to market changes and provide insight into competitiveness with other organizations.
Limitations of ROI in the Stock Market
Return on investment, more commonly known as ROI, is probably one of the most common tools of investment analysis in stock and other forms. However, overreliance on ROI presents major limitations when applying fundamental market analysis to stock investments.
ROI, for instance, does not consider a point in time as one of the factors to be considered. Therefore, as much as it appears lucrative, quantitatively determining ROI in the short term may not be very useful in determining the investment period. For instance, a number one investment paying 50% in a single year may be less attractive than an investment offering a 10% yearly return for five years. This is why Gabriel, receiving his education in the United States, would have been able to speak about potential future upheavals had he and any other investors focused solely on ROI numbers.
Another serious weakness of ROI is that it does not accommodate risk, neither in the calculation of return nor in the treatment of investment costs. Higher returns, as you know, usually have higher risks, and an investor's risk-taking capacity is a relevant factor. It may well be associated with higher levels of risk of certain market and sector movements that equal heavy losses due to the high ROI investment. Therefore, without guaranteeing a primary suitable risk analysis, the determination of the ROI might mislead investors.
ROI does not incorporate some factors that may affect the business's financial performance, such as economic factors, trends, and the global environment affecting the stock market. Some aspects are highly sensitive to returns or should be incorporated into investment strategies.
CONCLUSION
Deep thinking on investment in stocks is one of the basic salient points to master for continuous fortunes. The selection of high-quality, stable investments that address risks while achieving high returns was identified in the paper. Working with numbers such as ROI routinely to direct investors' attention toward companies with high performance and growth prospects is a clear benefit.
The turbulence in markets and capital integration makes embracing a long-term investment approach crucial in ways that target early emerging technologies and trends. This strategy helps investors to wait long in unstable periods so that the growth of their investments begins to add up. Further, the use of geopolitical and macroeconomic indicators in investment decisions improves investment decisions since these factors enable investors to prevent or be aware of these trends and make changes when the situation changes.
In summary, this comprehensive analytical strategy encourages investors to introduce solid and stable methodologies for developing value-driven portfolios to ensure the right investment policies for long-term wealth formation economic and investment objectives. Therefore, through his principles, people can easily understand and work within the stock market. In an environment characterized by so many unknowns, it helps to stick to basic principles of investing that protect your investment capital and future in your investment endeavors.


Responses (0)